Rising fuel prices foster the viability of rail transport

Halfway through the presidency of Bush 1, the Federal Railroad Administration conducted a comparative study between rail and truck transport to determine which mode was more fuel efficient, and its conclusion was a definite, if intuitive, one. Transportation of goods, when the commodity is modally competitive, requires less fuel by train. Since those days, new technologies have improved the transportation industry’s ability to meet customers’ ever more taxing expectations, themselves a product of the new technologies. Intermodal strategies, railcar designs, commodity mix: these are some of the aspects of the industry that experienced the most significant innovations, bringing with them increased efficiency across most associated costs, including fuel.

In 2009, the FRA conducted another study that recreated relative measurements from the 1991 study in an effort to find correlating results with current data and quantify the technological effect of the preceding two decades on fuel efficiency. 23 movements were examined where rail and truck compete for freight. No commodity movements were considered where either truck or rail are considered by industry standards to be a preferable means of transport.

Image

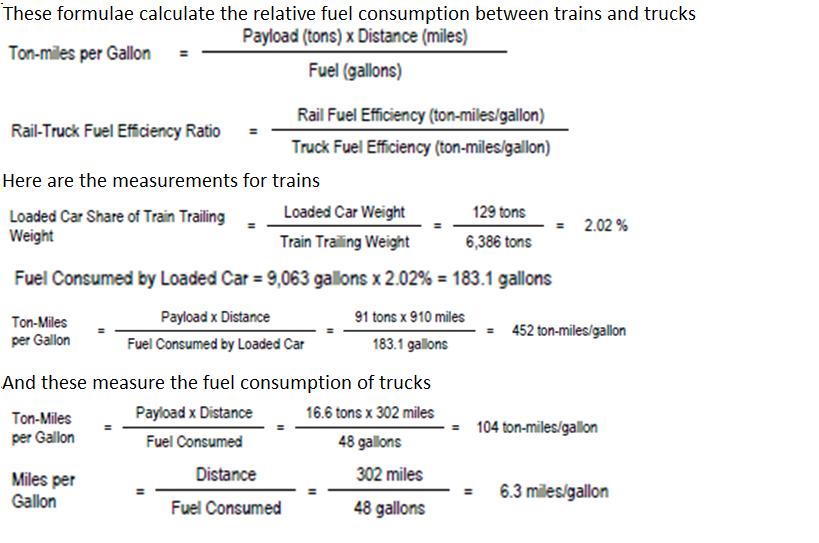
The FRA concluded that railroad transport’s fuel efficiency improved about 20% between 1990 and 2006, citing changes in traffic mix, technological improvements, and changes in operating practices as significant contributing factors. The fuel efficiency of trucks improved 11% between 1992 and 2002. Operational calibration and technological improvements to almost every mechanical aspect were the primary stimuli. The study’s conclusion asserts that the rising cost of fuel has incentivized this drive toward energy-conserving innovation in the transportation industry, and that the trend indicates a continuation of conservation consciousness, even if for the sake of the bottom line. Railroads are ideally suited to the anticipated effects. While the trucking industry has experienced an increase in freight activity of over 50% between 1990 and 2005, this despite the fact that it is less fuel efficient, as a mode of transportation its flexibility at every level is the reason for this. But as fuel costs continue to climb, the fuel efficiency of rail transport will drive the industry ever more toward intermodal designs, and the ensuing integration of train services within industry-wide strategies will increase rail operators’ modal vitality.

Posted in Uncategorized | Leave a comment

Land Bridge

Definition

An intermodal land bridge refers to the shipping of a container from one country to another using an ocean vessel and during the route the container must be unloaded on a body of land and transported completely across the landmass until it reaches another port where a second ocean vessel can finish the route.

Table of Contents

  1. Broader Explanation
  2. Advantages
  3. Current Examples
  4. References

1. Broader Explanation

Land bridges are typically used in transportation when containers have to travel long distances.  The container that is shipped using a land bridge must cross a body of water if it wants to reach its destination but large landmasses interfering with a direct route by water create a desire for intermodal transport.  In an attempt to save transit time, when the ocean vessel reaches the landmass that impedes its route to its destination the vessel is unloaded and then the container is loaded onto a motor carrier or a rail shipment to be ship completely across the landmass, from one port to another.  Upon reaching the second port the container is then loaded back onto another ocean vessel and shipped to its final destination.

Image

2. Advantages

One of the biggest advantages of shipping containers using land bridges is the dramatic increase in speed.  When shipping goods through they Panama Canal it can take as long as 7-8 to navigate through the different sets of locks while only traveling 51 miles.  In contrast during that same period of time rail and truck carriers could have traveled hundreds of miles.  In addition to the increase in speed of travel there is also a great reduction in the distance that the container will travel.  The use of a land bridge will almost be the most direct route and since the shortest distance from point A to point B is straight line the travel distance will be reduced.

3. Current Examples

Current examples of land bridges exist in countries all over the world.  The most efficient and popular one exists in North America and is referred to as the North American Land Bridge.  Shipping containers from Singapore to New York City takes an average of 36 days when the containers are taken through the Panama Canal.  When the same containers are taken from Singapore to New York City using the North American Land Bridge the trip will take only 19 days.  Also, a much more recent land bridge that has been put to use by DHL is a land bridge that extends through China and many of the post Soviet Russia countries to connect the Pacific Ocean to Mediterranean Sea.  The average transit time will be reduced from 35 to 42 days to 19-25 days and this method will cost 90% less than shipping the containers by air.

Image

4. References

http://air.logistics-business-review.com/news/dhl-launches-china-land-bridge-040511

http://info.jctrans.net/jcnet/il/lbmt/2007111542642.shtml

http://articles.tutorialonline.biz/portal/language-en/Intermodal%20freight%20transport

http://people.hofstra.edu/geotrans/eng/ch3en/appl3en/usalandbridge.html

http://en.wikipedia.org/wiki/Intermodal_freight_transport#cite_note-rushton-5

Posted in FS12_4, Uncategorized | Leave a comment

Rail Cost Structure

Fixed Costs

In the short-term period the indirect costs of operating in the rail sector greatly outweigh variable costs. The reason for the extensive amount of fixed costs is that the railroads own their own infrastructure. They have to account for the ownership and maintenance of their own network and terminals. They also operate their own railcars. So much of the Railways costs come from fixed assets that it is said up to two-thirds of the costs do not change with volume fluctuations. A major element contributing to the rail cost structure is the fact that the rights-of-way are not free like they are in other forms of transportation, such as the highways that motor carriers operate on. The extent to which railroad companies choose to invest in these fixed costs can depend on the service level they intend to provide as well as the size of their company. If a company is extremely dedicated to excellent service, they may choose to invest in the top of the line trains and infrastructure to improve the quality of their operations.

Semivariable Costs

The semivariable costs for the rail industry is mostly comprised of the maintenance of their rights-of-way, terminals, and other structures. Although the maintenance doesn’t seem like a large aspect, this has led to about a $10 billion investment in certain years. There has been an increase in the maintenance expenditures to make up for the deteriorated condition of many stations during the 1960’s and 1970’s when the rail industry dipped.

Variable Costs

The largest contributor to the to the variable costs of the rail cost structure is the labor aspect. In 2007 the total labor costs for the rail industry exceeded $14 billion. The average annual earning for rail employees is $69,367, comprised of mostly the train and engine employees as well as the maintenance crew. Fuel and power costs follow labor as the largest variable aspects to their cost structure.

Sources

Bardi, Eward J., Coyle, John J., Gibson, Brian J., Novack, Robert A. Transportation A Supply Chain Perspective. 7. Mason: South-Western Cengage Learning, 2011.

“Google Images.” Google Images. N.p., n.d. Web. 21 Nov. 2012. <http://www.google.com/imgres?num=10&gt;.

“Railway Reform: Toolkit For Improving Rail Sector Performance.” Railway Reform: Toolkit For Improving Rail Sector Performance. N.p., n.d. Web. 21 Nov. 2012. <http://www.ppiaf.org/sites/ppiaf.org/files/documents/toolkits/railways_toolkit/ch2_1_2.html&gt;.

Posted in Uncategorized | Leave a comment

Load Tendering

Load Tendering: When descriptive information and pricing which has been bargained are provided to the carrier before pickup is scheduled.  This can help to guarantee that contracts are followed and will also streamline self-payments.

The Overview of Load Tendering:

A shipment retrieval request sent from carrier to shipper is called a load tender.  The load tender process is defined by its ability to tender multi-leg deliveries, single delivery, or a trip of numerous deliveries.  The process of load tendering consists of requesting a load tender from a carrier and giving them the ability to respond by rejection or acceptance.  The different types of load tender requests include delivery numbers, consignee’s order numbers, freight terms, dock close time, hazardous materials, and commodity.  Seeing fleshed out information about pickup and delivery is what load tenders enable.  If carrier remarks, which are supplied through the carrier porter tender, are desired, then they can be seen on the trip workbench.  Workflow messages sent to carriers by email is another aspect of load tendering.  Responses to tender requests can be given through portals which carriers can access.  The primary use of load tendering exists in smaller transports such as marine, full truckload, and truckload.  These types of small parcel segments are delegated by a smaller equivalent, carrier manifesting.  Tendering each delivery to a carrier is not effective in small parcel environments since a high amount of deliveries are processed.

The Advantages of Load Tendering:

  • Communicate load tenders and information with your carriers directly, regardless of their proficiency with IT.
  • Information and processes about load tenders will be evenly distributed across varied facilities, locations, and units of business.
  • Provide load information to all participants including third parties, suppliers, and customers.
  • Information about EXW and FCA carriers will be known in advance, so that surprises will be terminated
  • Upon arrival, handling of carriers will be streamlined
  • Increase chances to save costs by taking advantage of return truckloads

Tendering Flow:

  1. Submit a Tender
  2. Receive a Tender
  3. Cancel a Tender

Load Tendering Processing:

Reference:

http://www.inboundlogistics.com/cms/logistics-glossary/

http://docs.oracle.com/cd/B25284_01/current/acrobat/115fteug.pdf

http://www.transwide.com/en-nafta/solutions/execution/load-tendering

http://www.personal.psu.edu/lug113/ucr/TYMTalkPOM502.pdf

Team: FS12_02 (11/21/2012)

Posted in FS12_2, Uncategorized | Leave a comment

Very Large Crude Carriers (VLCCs)

 Definition

VLCC stands for Very Large Crude Carriers, which is a classification of oil tanker.  They were introduced in the 1970s and are an essential part of the transportation industry because they are able to transport massive quantities of crude oil across the globe.

Table of Contents

1. Broader Explanation

2. Classification

3. Advantages

4. Disadvantages

5. References

1. Broader Explanation

VLCCs have the capacity to carry about two million barrels of oil.  They are used to transport oil over long distances.  Hence, they usually transport oil from the North Sea, Mediterranean Sea, and West Africa to North America, Europe, and Asia.  VLCCs normally have a crew of around two dozen and cost at least $100 million.

2. Classification

VLCCs are the second biggest type of oil tankers.   The size of these oil tankers range form 160,000 to 319,999 in deadweight tonnage using the AFRA scale.  Anything larger is called a Ultra Large Crude Carrier (ULCC).

3. Advantages

The biggest advantage of VLCCs is their efficiency in transporting crude oil.  They can carry huge quantities of crude oil in bulk, therefore economies of scale canbe greatly realized.  When transporting oil in a tanker, it only costs about two to four cents per gallon.   There is no other transportation method that can move so much oil at a time like an oil tanker can and because of a VLCCs enormous size, this advantage is even greater.

Another advantage is owners of VLCCs can obtain profits of at least $60,000 a day after expenses.  Profit depends on a handful of factors, such as how strong the market is and tanker availability.  If there is high oil demand, VLCC owners would potentially see a large increase in profit.

4. Disadvantages

Oil tankers have some drawbacks, such as oil spills, which can become a substantial problem.  A spill would pollute an area and could destroy an ecosystem.  Not to mention, there could be a sizeable lawsuit.   This disadvantage of oil tankers is extrapolated with VLCCs because of their massive size.  If a VLCC has an oil spill it would have a much more drastic effect than if a small tanker had an oil spill and because of this VLCCs are more risky than most oil tankers.  The vast size of VLCCs magnify the consequences of an accident.  A double hull is required on every new tanker to help guard against an oil spill.  A double hull creates more space between the oil tanks and the hull.  With a double hull, an oil tanker is less susceptible to an oil spill, but an accident could still occur.

Fires aboard VLCCs also are a risk.  Because of all of the oil aboard the ship, if a fire starts it would spread easily throughout the ship.  This is the most serious type of hazard because all of the crew member’s lives would be at risk.  To help safeguard against this, every tanker that is 20,000 DWT and above is required to install inert gas systems.  The systems pumps inert gas into the empty tanks and into the tanks partially filled with oil.  The gas makes the air in each tank virtually impossible to ignite.

5. References

  1. http://en.wikipedia.org/wiki/Oil_tanker
  2. http://geography.about.com/od/urbaneconomicgeography/a/oiltankers.htm
  3. http://geography.about.com/gi/o.htm?zi=1/XJ&zTi=1&sdn=geography&cdn=education&tm=2309&gps=451_1809_1366_628&f=10&su=p284.13.342.ip_&tt=2&bt=0&bts=0&zu=http%3A//science.howstuffworks.com/oil-tanker.htm
  4. http://people.hofstra.edu/geotrans/eng/ch2en/conc2en/ch2c2en.html

Team: FS_18 (Novemeber 21, 2012)

Posted in FS12_18 | Leave a comment

Transportation Rates

Brief Definition

Transportation Rates are the negotiated costs of moving freight from one origin to the destination. All costs associated with beginning to end of the shipment may be evaluated.

Broad Explanation

Transport costs are a monetary measure that the provider must pay to produce transportation services whether this is by truck, rail, ocean carrier, air, or pipeline. Transportation costs are influenced by the respective rates of transport that companies charge users. These rates are negotiated cost of moving freight from one origin to the destination. Rates are subject to competitive pressure. This means that a rate will be adjusted according to the demand and the supply.  All modes of transportation will see both rate and volume increases, an indication that the recession has bottomed and companies are replenishing their inventories.

Table of Contents

  1. Trucking Rates
  2. Exhibit 1- Current US Freight Rate Index
  3. Factors affecting Truck Rates
  4. Determining Rates
  5. Air Rates
  6. Exhibit 2- Rate/Volume Increase by Type of Mode
  7. References

________________________________________________________________

1. Trucking Rates

Trucking rates are rising at an accelerated pace especially in long distance LTL trucking. Transportation firms have become very effective at maximizing the profit per shipment, which will increase the rates in the industry. Also, there is a labor shortage in the trucking industry due to the high turnover rate. There is a shortage of qualified drivers, which is driving up the prices for shipping services. Additionally, there is increased competition from other service-based industries, which is reducing the labor pool even more. Another trend in the trucking industry affecting the transportation rates are the high diesel prices. The volatility of crude oil on the international market is driving up the price of fuel. Lastly, there are bankruptcies occurring in the trucking industry especially between the years 2007-2011 due to the lack of credit and being unable to secure cash for needed daily operations.

2. Exhibit 1- Current US Freight Rate Index

3. Factors affecting Trucking Rates

Some of the factors that can affect trucking rates include the value of shipping, contract pricing, numerous accessorial charges, technology, rebates, service level, and value-added services. Trucking rates are dependent on market rates for specific merchandise and they factor in fuel costs, miles and costs per lane. The ton-per-mile max, which affects the trucking rates, is calculated by the weight of each truck for each trip.

4. Determining Rates

There are basics when negotiating transportation rates between consumers and carriers. The carrier should determine the trucking rate by determining the loading and unloading environments. Also, identifying the packaging and weight of the load can increase or decrease the freight rate. Then, simply define the trucking freight rate class. The classes are associated with a pound-per-cubic-foot-density. Estimating the density of the cargo to be shipped will help a lot in determining a fair transportation rate. The density and trucking rate are the cargo’s total pounds divided by the cubic feet of the cargo holder.

5. Air Rates

The average air prices for all air transportations jumped in 2001 by 2.1%. Buyers of nonscheduled freight services on domestic flights bore the brunt of inflation. Rates for airfreight in the US are typically very high due to the high-speed delivery especially with same day delivery that’s on the rise. Also, a lot of new technology product launches in the fall and winter seasons have increased airfreight rates because these companies want to make sure their products are in the right place at the right time. The best way to move high-end technology products is via air because it is the most secure.

6. Exhibit 2: Rate/Volume Increase by Type of Mode

Mode Rate Increase Volume Increase
Rail 2.5% 2.6%
Intermodal 0.9% 2.1%
Truckload 0.6% 2.7%
Regional LTL 0.7% 2.1%
National LTL 0.7% 1.5%

7. References:

http://www.genco.com/transportation/transportation-industry-trends.php#trend1

http://www.logisticsmgmt.com/article/transportation_pricing_trends_-_december_2011/

http://mhlnews.com/distribution/transportation-rates-rise-all-modes-0524

http://www.freightrateindex.com/

FS12-18

Posted in FS12_18, T | Leave a comment

Shipping Conferences

  • Brief Definition

Agreement between two or more shipping companies to provide scheduled freights or passengers service on particular routes under uniform rates and common terms.

  • Broader Explanation

A shipping conference, is an association of several shipping companies that follow certain terms and then provide services. Shipping conferences member may agree on such matters like price fixing, total industry output, market shares, allocation of customers and the division of profits or combination of those. Even then, as most of conferences gain a huge monopoly power, shipping conferences is to increase individual member’s profits by reducing competitions.

  • Functions

Shipping conferences are represent for every members benefits based on free trade, with following functions:

  1. Shipping conference tend to monopoly certain particular routes, reduce rivals among the industry to increase every conference member’s profits.
  2. According to every members exchanging suggestions, conferences make a policy provides to members.
  3. Collaborate with other technological, manufacture, and business within same situation.
  • Disadvantages of Shipping Conferences

Recently, most shipping conferences are exempted from United States markets based on the application of Antitrust Laws since 1914. Here are several negative impacts on markets of shipping conferences.

  1. Monopoly Power:  Any shipping carrier as a part of shipping conferences tend to have monopoly power in the markets.  For instance, if a shipping carrier leave the conference, conference can easily lower the price and make it out of the business.
  2. Lack of Choice: There is only few choices to choose, the market is less competitive, so there is lack of differences among each shipping carriers.
  3. Low threat of entry: Even though shipping conference members can reduce the competition between the industry, some shipping conference will charge higher rates.
  • Government Responses to Shipping Conferences
    The Sherman Antitrust Act of 1890 outlawed all contracts, combinations  that unreasonably restrain interstate and foreign trade. This includes cartel violations, such as price fixing and customer allocation. Sherman Act violations involving agreements between competitors are usually punishable as federal crimes.
  • Reference:

What Are the Disadvantages of a Shipping Conference? | eHow.com http://www.ehow.com/info_8681021_disadvantages-shipping-conference.html#ixzz2CrDEtQ6G

http://www.oecd.org/regreform/liberalisationandcompetitioninterventioninregulatedsectors/2376087.pdf

Posted in FS12_8 | Leave a comment

Value of Service Pricing

Value of Service Pricing

Value of service pricing (VOS), which can be viewed as value based pricing (more general), is a business pricing strategy. The terminology of VOS is especially widely used in logistic or service industry.  Value of service pricing, sets price primarily but not exclusively, on the value perceived by customers rather than cost. In other words, value of service pricing is based on the utility factor of the service, which is estimated by customers.

Table of contents

  • Utility factor
  • Relationship with cost of service pricing
  • Further AnalysisAdvantage and Disadvantage


1.     How to define utility factor

The hardest part about VOS is finding out the utility a customer receives from the service that the carrier offers.  One way to figure out the utility factor is to view the price from a customer perspective and seeing how much time or money can be saved when customer choose to use the specific service that carrier is providing. For example, from the view of customers, the “same day delivery” service providing by UPS is only valuable to customers in a desprate need situation.  Otherwise, the premium rate it charged will not be accepted by common customers.

2.     Relationship with cost of service pricing

Cost of service pricing is also a pricing strategy, in which cost is used as a primary variable comparing with VOS.  Sometimes they can lead to similar prices, but in general, the prices derived from value are always greater or equal to the prices based on cost. Besides, cost of service pricing is much easier to find out because the makeup of the service cost is the only thing that needs to be known.

Different hierarchy variable in value of service pricing and cost of service pricing (reference: http://www.launchengineering.com/Pricing_Strategy.htm)

  1. Further Analysis :

Advantage: Profit maximizing approach

Value of service pricing is viewed as a profit maximizing approach when carrier charges their customers at competitive level the market will bear. Thus, level of competition and current service demand volume are two critical criteria to determine the price of the service.  If the service of specific carrier is in high demand with less competition, the price will tend to be quite high. As the competitors notice the high profit potential of this service, the competition will increase, and the price will be decreased with the supply increase.

Disadvantage: When company uses value of service pricing strategy, there is huge danger if there is strong competition in the market. Thus, value of service pricing strategy will not be effective if competitors are able and willing to drastically cut down their rate while offering the same service.

Reference:

Wisner, Tan And Leong. Principal of Supply Chain Management: A Balance Approach. ISBN-13: 978-0324657913

http://books.google.com/books?id=8JM6wU_sBc0C&pg=PA315&lpg=PA315&dq=value+of+service+pricing+is+also+called&source=bl&ots=pZu4o8H6cL&sig=r-z3k4SNrqizIvmedSOvU4ELxuI&hl=en&sa=X&ei=chqsUP29KKiS2QXRg4DAAg&sqi=2&ved=0CD0Q6AEwAg#v=onepage&q=value%20of%20service%20pricing%20is%20also%20called&f=false

http://www.launchengineering.com/Pricing_Strategy.htm

http://www.ehow.com/info_12009702_relationship-between-valueofservice-pricing-costofservice-pricing.html

FS12_15

Posted in FS12_15, Uncategorized | Leave a comment

Motor carrier cost structure

Motor carrier cost structure is the expense that must be taken into account when the firm manufactures a product or provides a service. This includes transaction cost, operating costs, fixed costs and variable cost.

Content List:

  1. 1.   Primary cost category
  2. 2.   Characteristics of cost
  3. 3.   Further analyze
  4. 4.   Reference


1. Two primary costs impacts:

Fixed vs. Variable Cost:

For the cost structure of motor carriers, approximately 70% to 90% costs are variable, which allow the carrier to increase/decrease the number of vehicles used in short period of time and in small increments of capacity. An example of variable cost is fuel, because fuel price is changing all the time. A motor carrier industry has low fixed costs due to the public investment of the highway system and few terminals needed, because motor carriers are general door to door service, which is reduces the need for terminals.


2.Classification:

Transaction cost – is the cost during the transaction, the carrier have to pay the amount of money to guarantee the delivery can be reached on time. An example of this is that Motor carrier should provide insurance to the customer due to the to cover their liability. This rate has increased over the last several years because of a survey called the “American Trucking Associations (ATA)”, this survey passed the rise of insurance rates.

http://ops.fhwa.dot.gov/freight/publications/eval_mc_industry/index.htm


Operating cost is the expense that related to the operations of a business. For the motor carriers, this cost includes fuel charges and labor costs. Fuel price is an important issue for many motor carriers. If fuel price changed frequently or suddenly, small motor carriers may effect a lot, or bankrupt.

http://ops.fhwa.dot.gov/freight/publications/eval_mc_industry/index.htm

Labor issue is a big component of the service industry. The working hours of drivers directly effects the cost or gain of the firm. Since the government announced the “Hours of Service”, a driver can work up to 10 hours or be on duty 15 hours since the end of his/her last 8 hours break. This policy may reduce the efficiency of the carriers, and loos money.

3. Further analyze:

Motor carriers operate business in two types, Truckload (TL) Carriers and Less-than-truckload (LTL) Carriers. TL carriers provide a full truckload shipment service to shippers between local and inveracities. Less-than-truckload (LTL) Carriers provide service to shippers who tender shipments lower than minimum truckload quantities. LTL is a more efficient method because this idea is combine some smaller shipments into TL quantities and disintegrated TL shipments into smaller quantities.

http://ops.fhwa.dot.gov/freight/publications/eval_mc_industry/index.htm#5

4. References:

http://ops.fhwa.dot.gov/freight/publications/eval_mc_industry/index.htm#5

http://www.intrans.iastate.edu/reports/ltlcarriers.pdf

http://mhlnews.com/distribution/outlog_story_7008

http://www.google.com/url?sa=t&rct=j&q=&esrc=s&source=web&cd=1&cad=rja&ved=0CDMQFjAA&url=http%3A%2F%2Fwww.jsu.edu%2Fdepart%2Fccba%2Fjthomas%2Fdownloads%2F370%2F370sp07motorcarriers.ppt&ei=UGasUP_ZA4TvygHY0IHoBQ&usg=AFQjCNE4ltwozmb4MY-osBL6GMljq-yT6A&sig2=Qarnk4XLe_ymz3rvwTKLzQ

FS12_15

Posted in FS12_15, Uncategorized | Leave a comment

Point to point rates

  • Definition
  • Advantages and Disadvantages
  • Examples.

Definition

Point to point rates refers to the rate one pays if transporting goods through a point-to-point transit system.  A point-to-point transit system does not use hubs to consolidate goods, cross docking nor does it use any form of break bulk to break up shipments into smaller portions. It directly ships the goods from manufacturing to the endpoint, putting the burden of warehousing on them.

Point-to-Point rates are used for a shipping lane with predictable high volume traffic, for example raw materials from a specific location to the factory. It makes more sense to apply a consistent rate for that lane, rather than based off of volume or mileage.

http://www.naefrontiers.org/Symposia/USFOE/…US…/21909.aspx

  1. Advantages of point to point rates
    1. Less fixed costs, due to the lack of distribution centers
    2. Can be faster due to a direct path
    3. Won’t be delayed by issues at the hubs, is a simpler system
    4. If volume is large enough, can benefit from economies of scale
  2. Disadvantages of point to point rates
    1. Inventory costs will be higher
    2. More trips are needed to cover all destinations

Examples

Point-to-point rates are used quite often in transportation. It is most commonly used in air travel, due to the already limited number of hubs. Due to the large volume of passengers that travel between large cities, it makes more sense to have consistent service between the two destinations.

In the context of logistics, it is used to cover a shipping lane with a large consistent volume. For example, a lumber mill transporting wood to a manufacturing plant.  The two points in the logistics network are unlikely to change, and can be covered by a point-to-point rate.

http://books.google.com/books?id=5hOBPFGhOlsC&pg=SA17-PA4&dq=point-to-point+rates&hl=en&sa=X&ei=y2CsUMX9MMna2wWBxIFg&ved=0CC0Q6AEwAA#v=onepage&q=point-to-point&f=false

http://blogs.cornell.edu/info2040/2011/09/14/hub-and-spoke-vs-point-to-point-transport-networks/

FS12_15

Posted in FS12_15 | Leave a comment